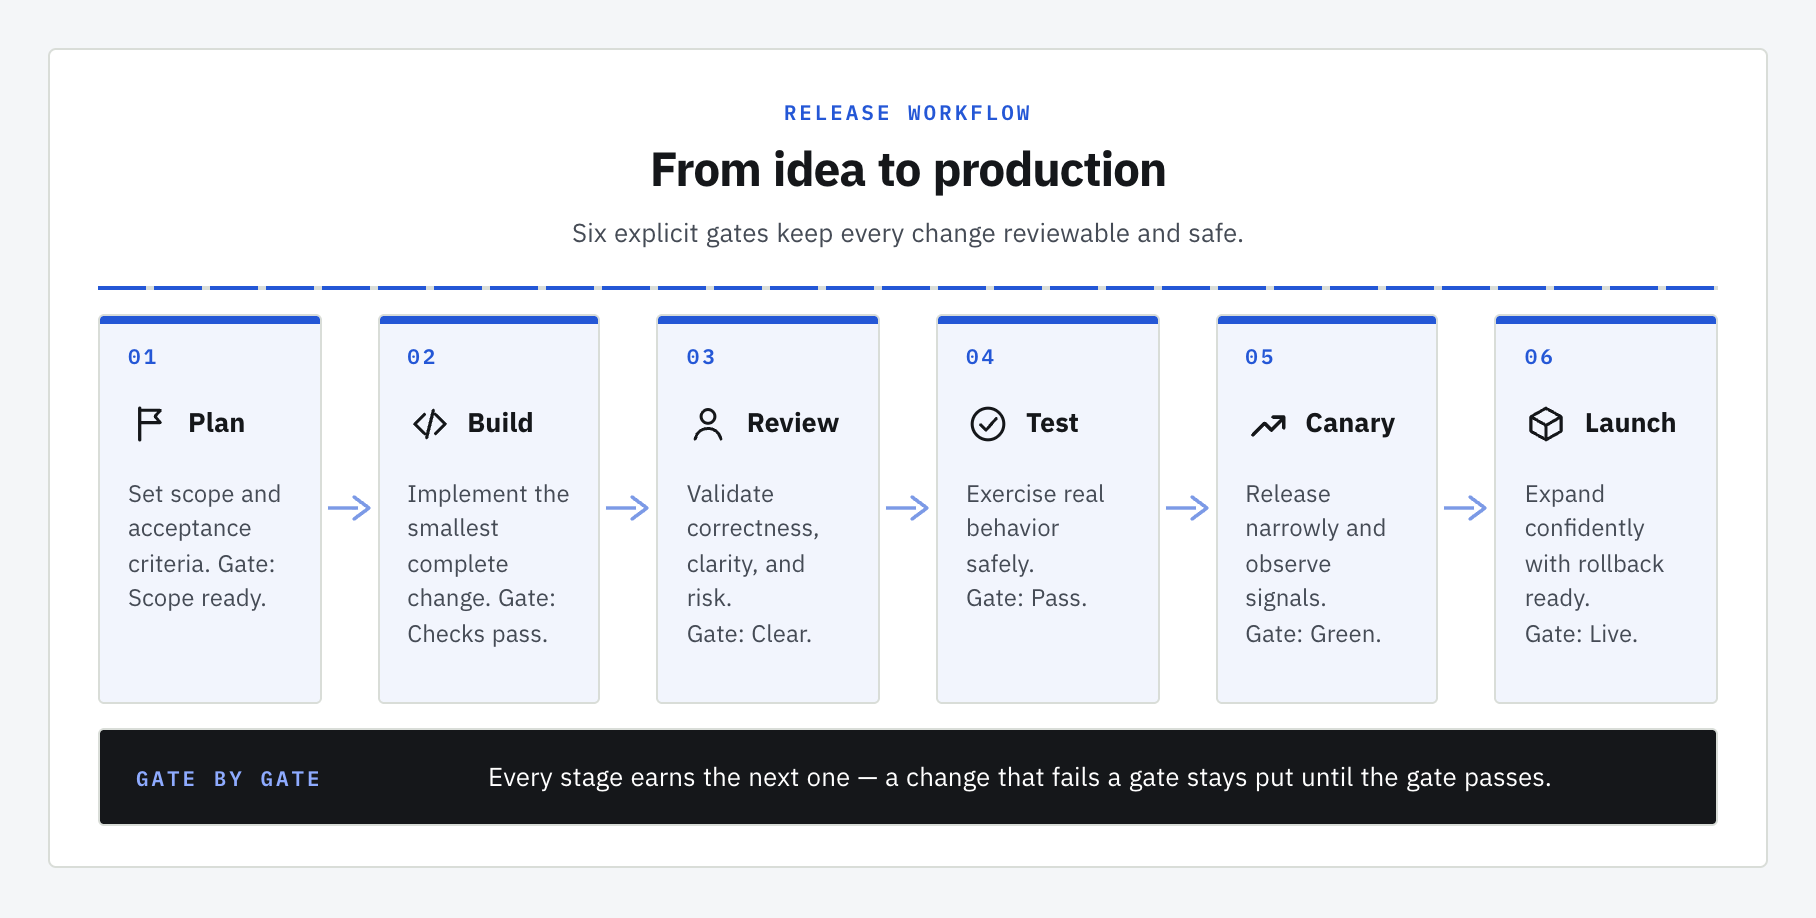
Different ideas deserve different diagrams.

A system map, a project plan, a funnel. Pick the result that fits your work, copy its prompt, and bring your own notes to an agent. Keep the HTML and ask for PNG to share.

Choose a result. Make it yours.

Example walkthrough

Five real outputs, five visual themes. Select an image to see its source prompt and download the files.

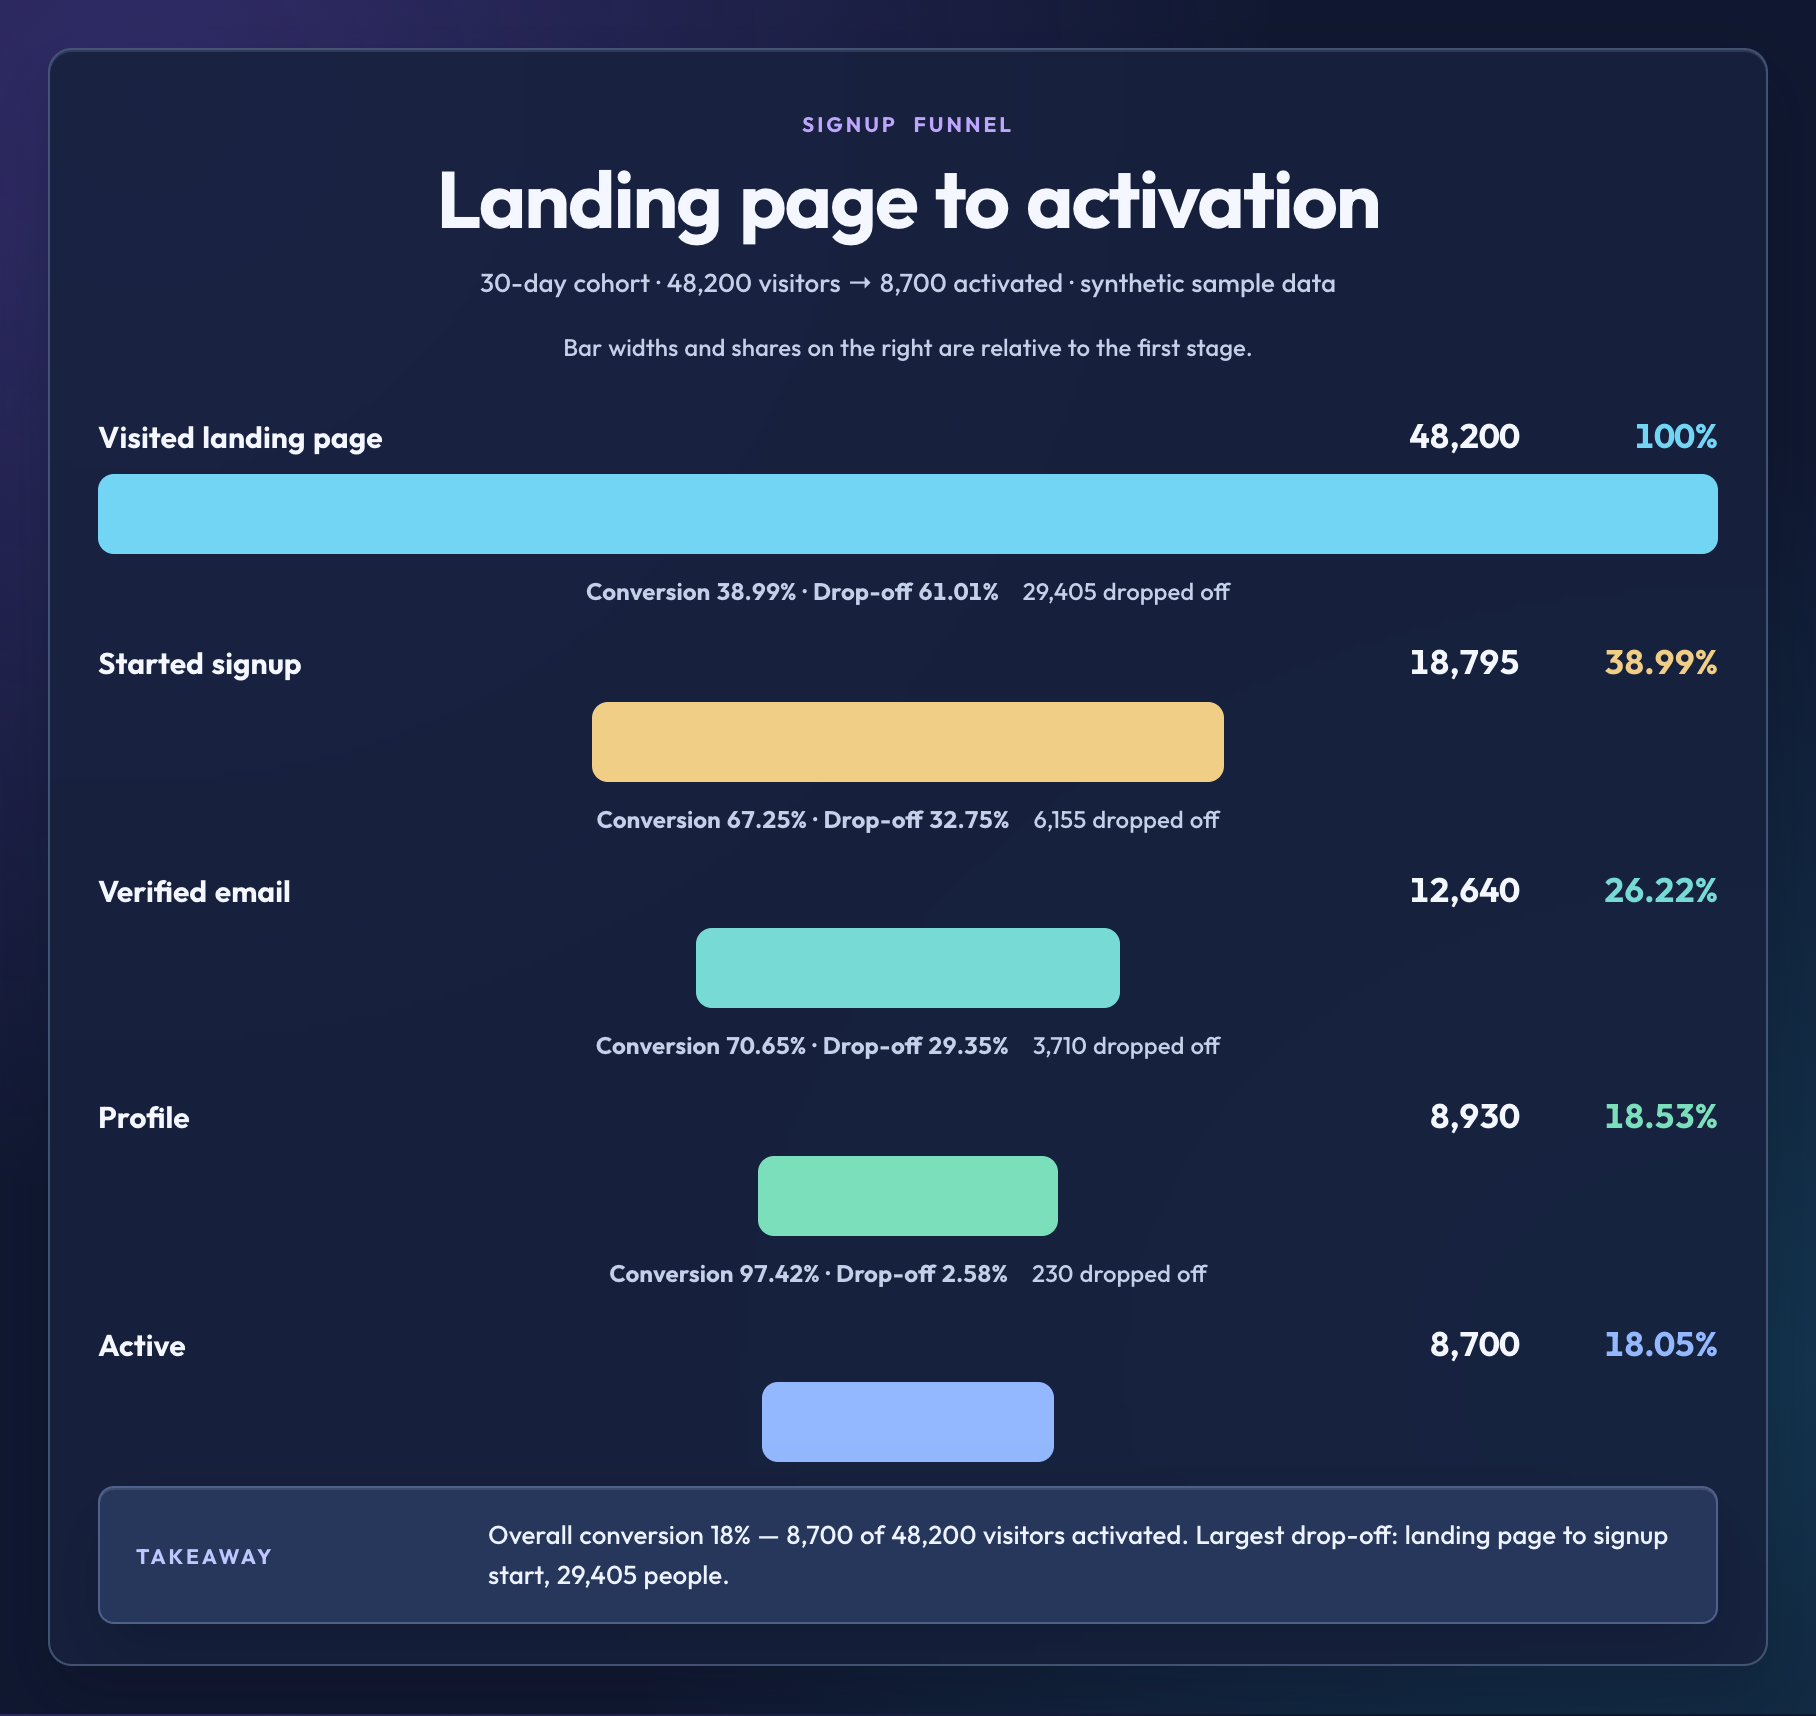
Funnel:Landing page to activation
Rendered example Open HTML preview
Funnelglass

Landing page to activation

A five-stage signup funnel where every share, stage-to-stage conversion rate, and drop-off count is computed from the five stated stage volumes.

Read the source prompt
Make a glass funnel for our 30-day signup cohort: 48,200 visited the landing page, 18,795 started signup, 12,640 verified their email, 8,930 completed a profile, and 8,700 activated. For each stage show its share of all visitors, and between stages show the conversion rate and how many people dropped off, both computed from those volumes. Add nothing that the numbers do not support.
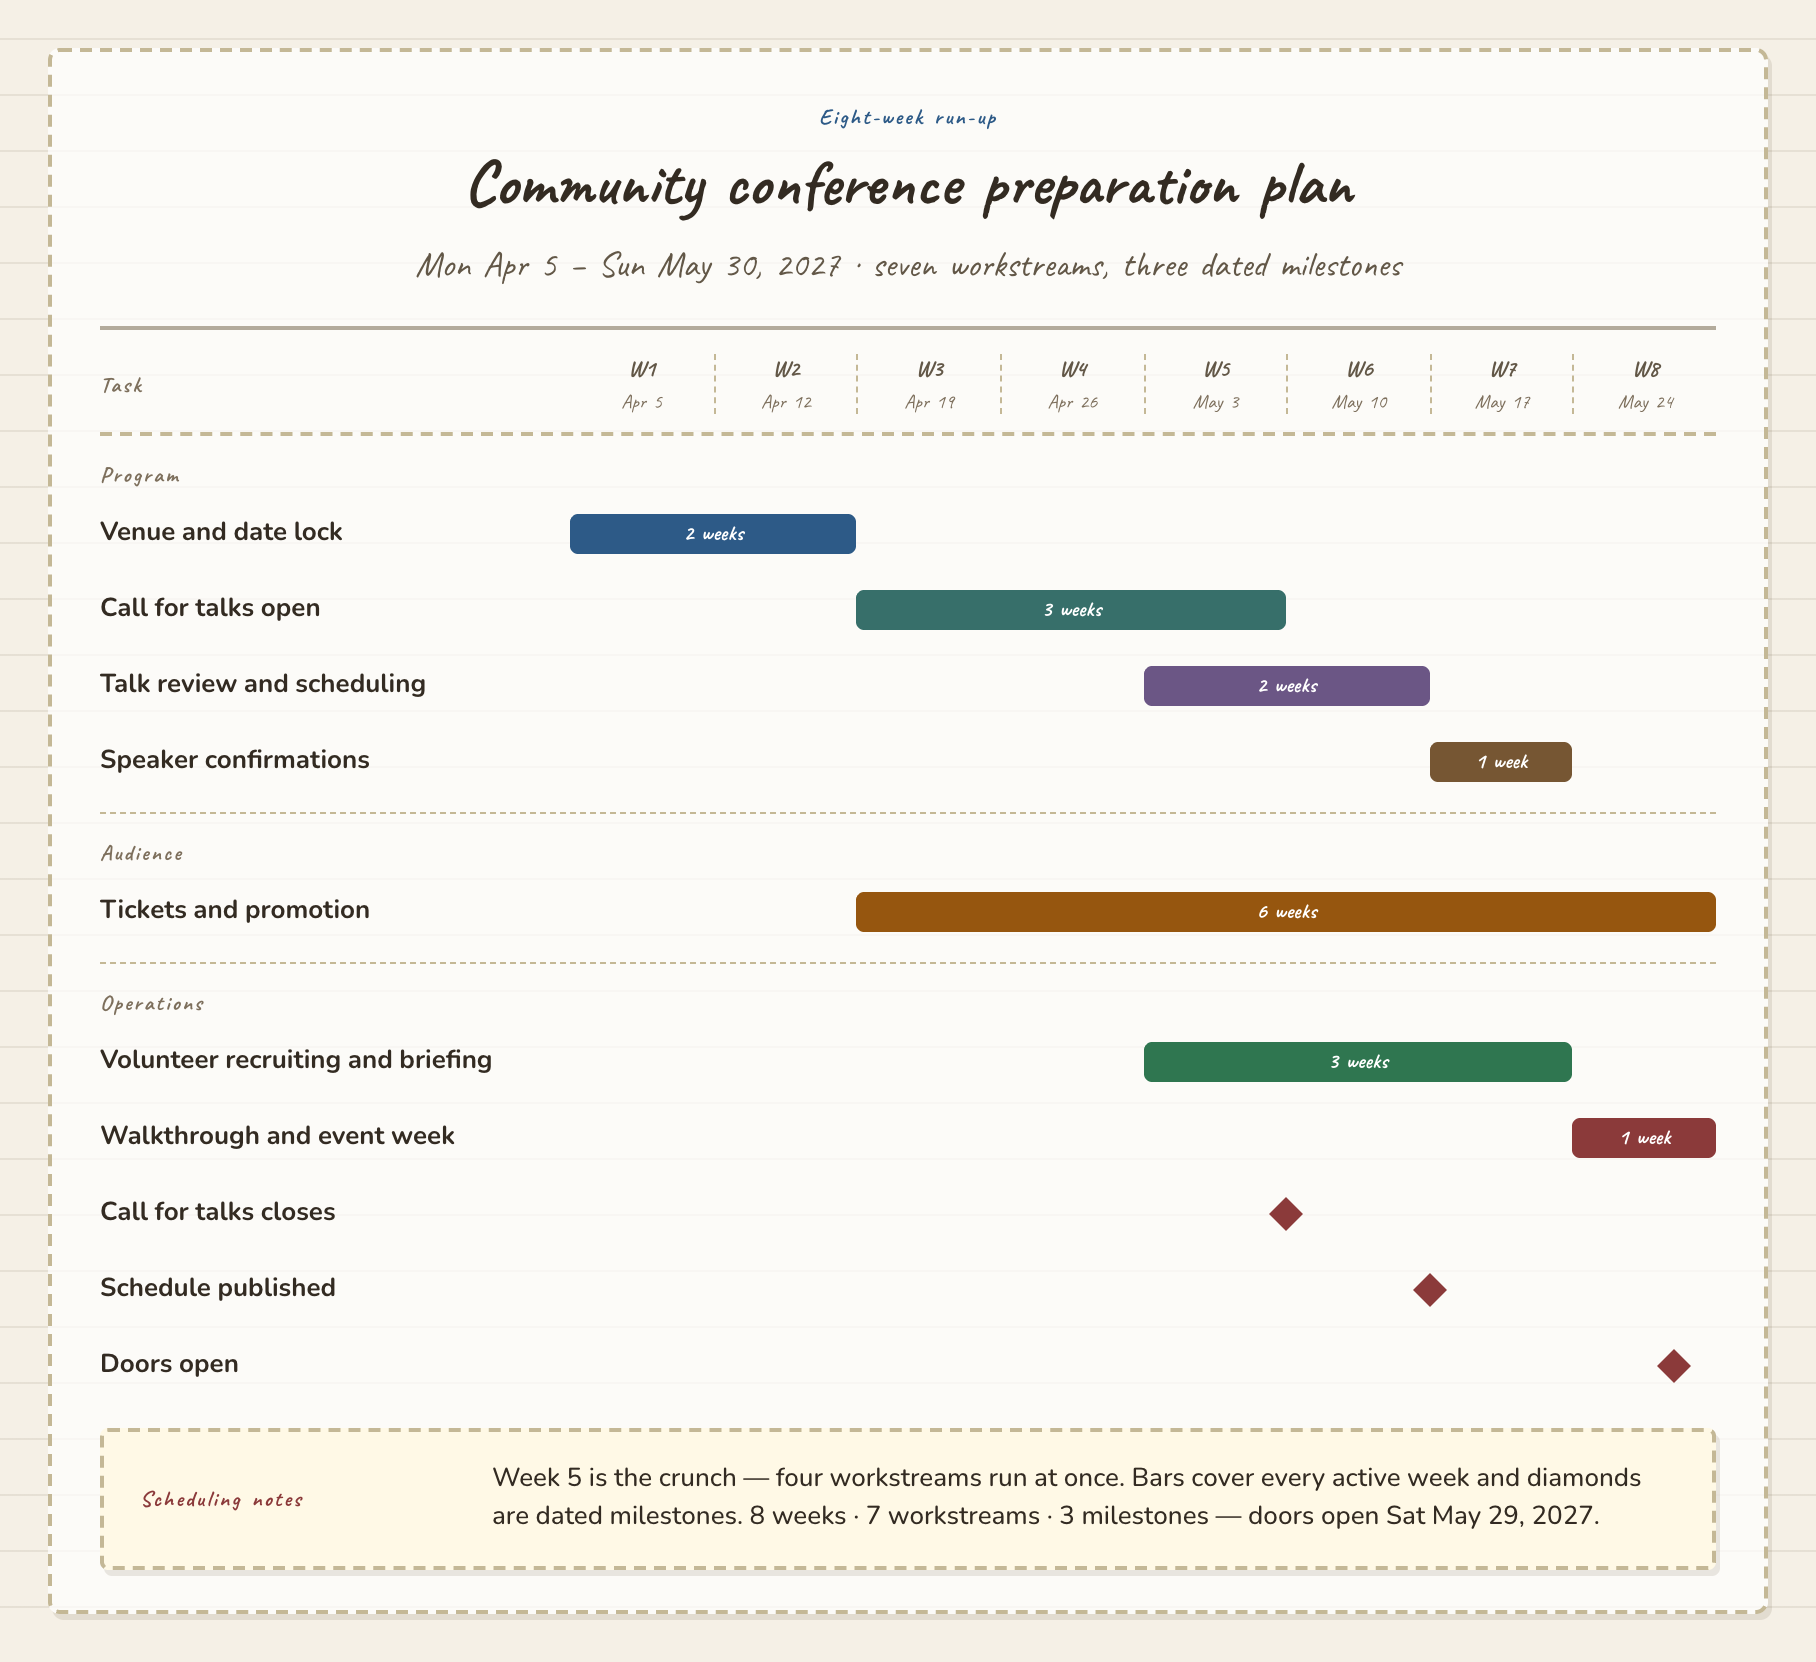
Gantt plan:Community conference preparation plan
Rendered example Open HTML preview
Gantt plannotebook

Community conference preparation plan

Seven workstreams on an eight-week axis, with deliberate overlaps and three dated milestones.

Read the source prompt
Draw a notebook-style Gantt chart for our eight-week community conference run-up, weeks starting Mon Apr 5 2027. Venue and date lock W1-W2. Call for talks open W3-W5, starting after the venue is locked. Talk review and scheduling W5-W6. Speaker confirmations W7, after review. Tickets and promotion W3-W8. Volunteer recruiting and briefing W5-W7. Walkthrough and event week W8, after the volunteer briefing. Milestones: call for talks closes end of W5, schedule published end of W6, doors open Sat May 29. Show a week-number axis.
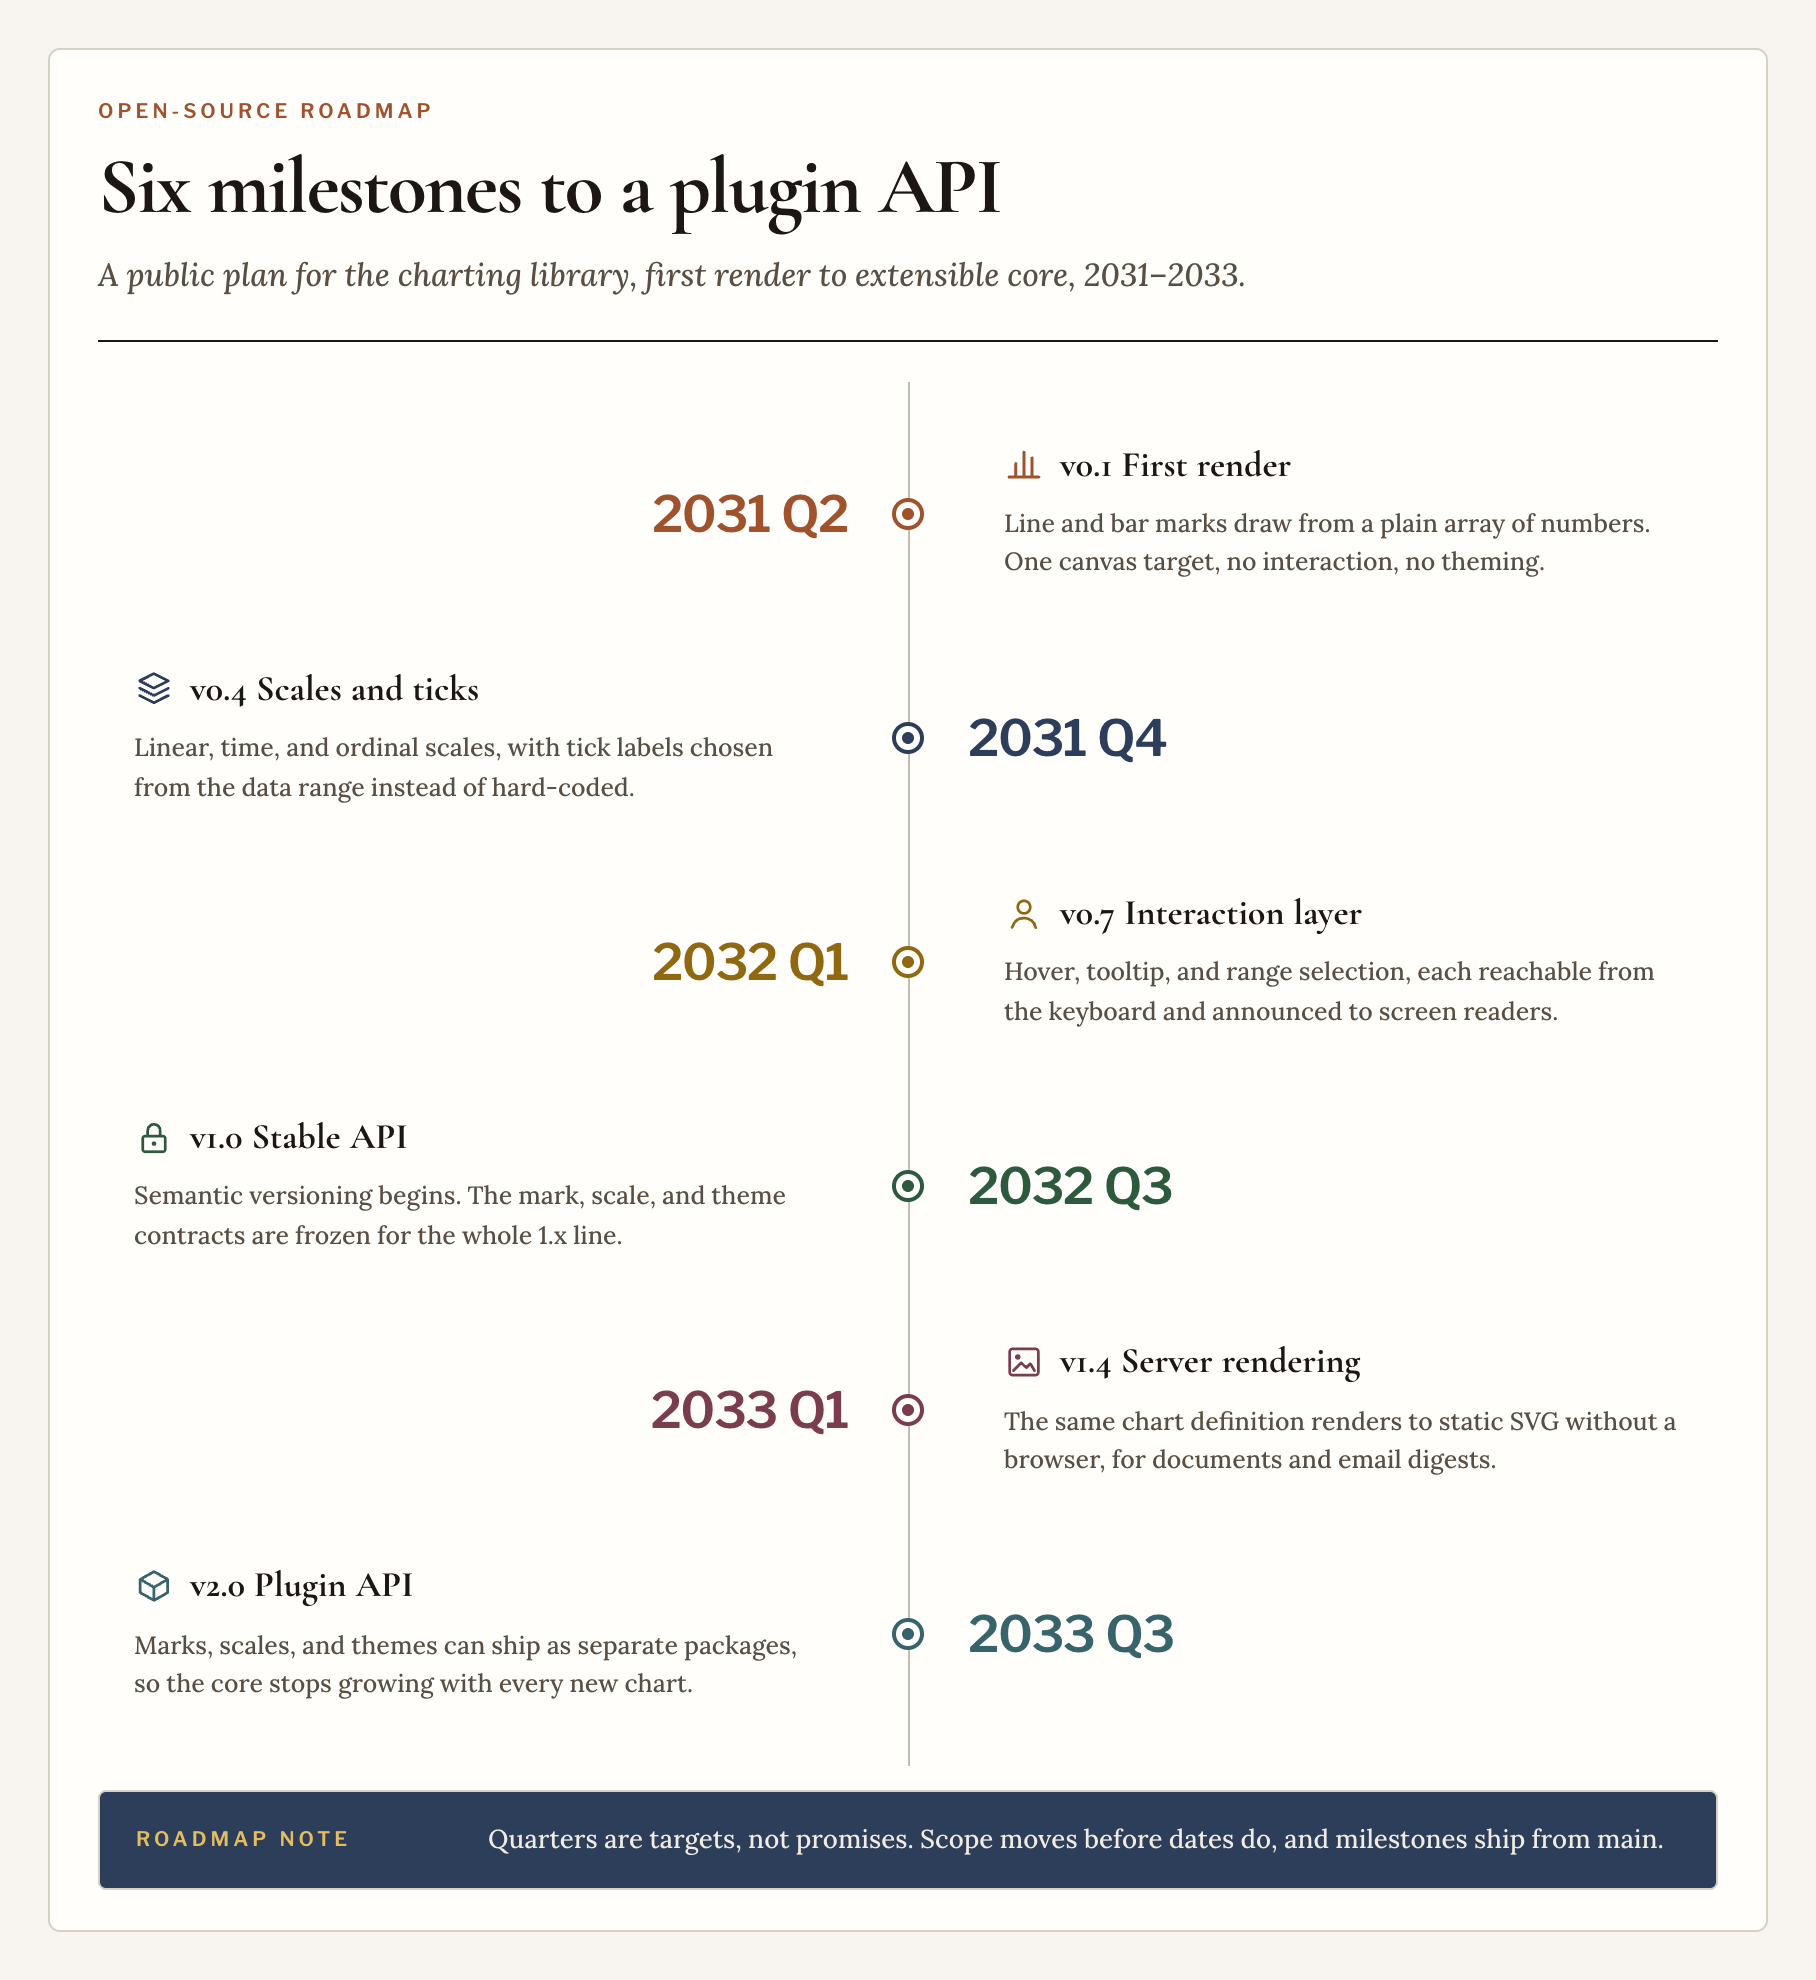
Timeline:Six milestones to a plugin API
Rendered example Open HTML preview
Timelineeditorial

Six milestones to a plugin API

An alternating milestone timeline where every version, quarter, and scope note is taken from the request, with nothing added between milestones.

Read the source prompt
Draw an editorial timeline of the public roadmap for our open-source charting library, subtitled "first render to extensible core", six milestones: 2031 Q2 v0.1 first render (line and bar marks from a plain number array, one canvas target, no interaction or theming); 2031 Q4 v0.4 scales and axes (linear, time, ordinal scales with tick labels derived from the data range); 2032 Q1 v0.7 interaction layer (hover, tooltip, range selection, keyboard reachable and announced to screen readers); 2032 Q3 v1.0 stable API (semantic versioning starts, mark/scale/theme contracts frozen for 1.x); 2033 Q1 v1.4 server rendering (same definition renders to static SVG without a browser, for documents and email digests); 2033 Q3 v2.0 plugin API (marks, scales, and themes ship as separate packages, so the core stops growing with every new chart). Close with a note that quarters are targets, not commitments, that scope moves before a date does, and that every milestone ships from the main branch.
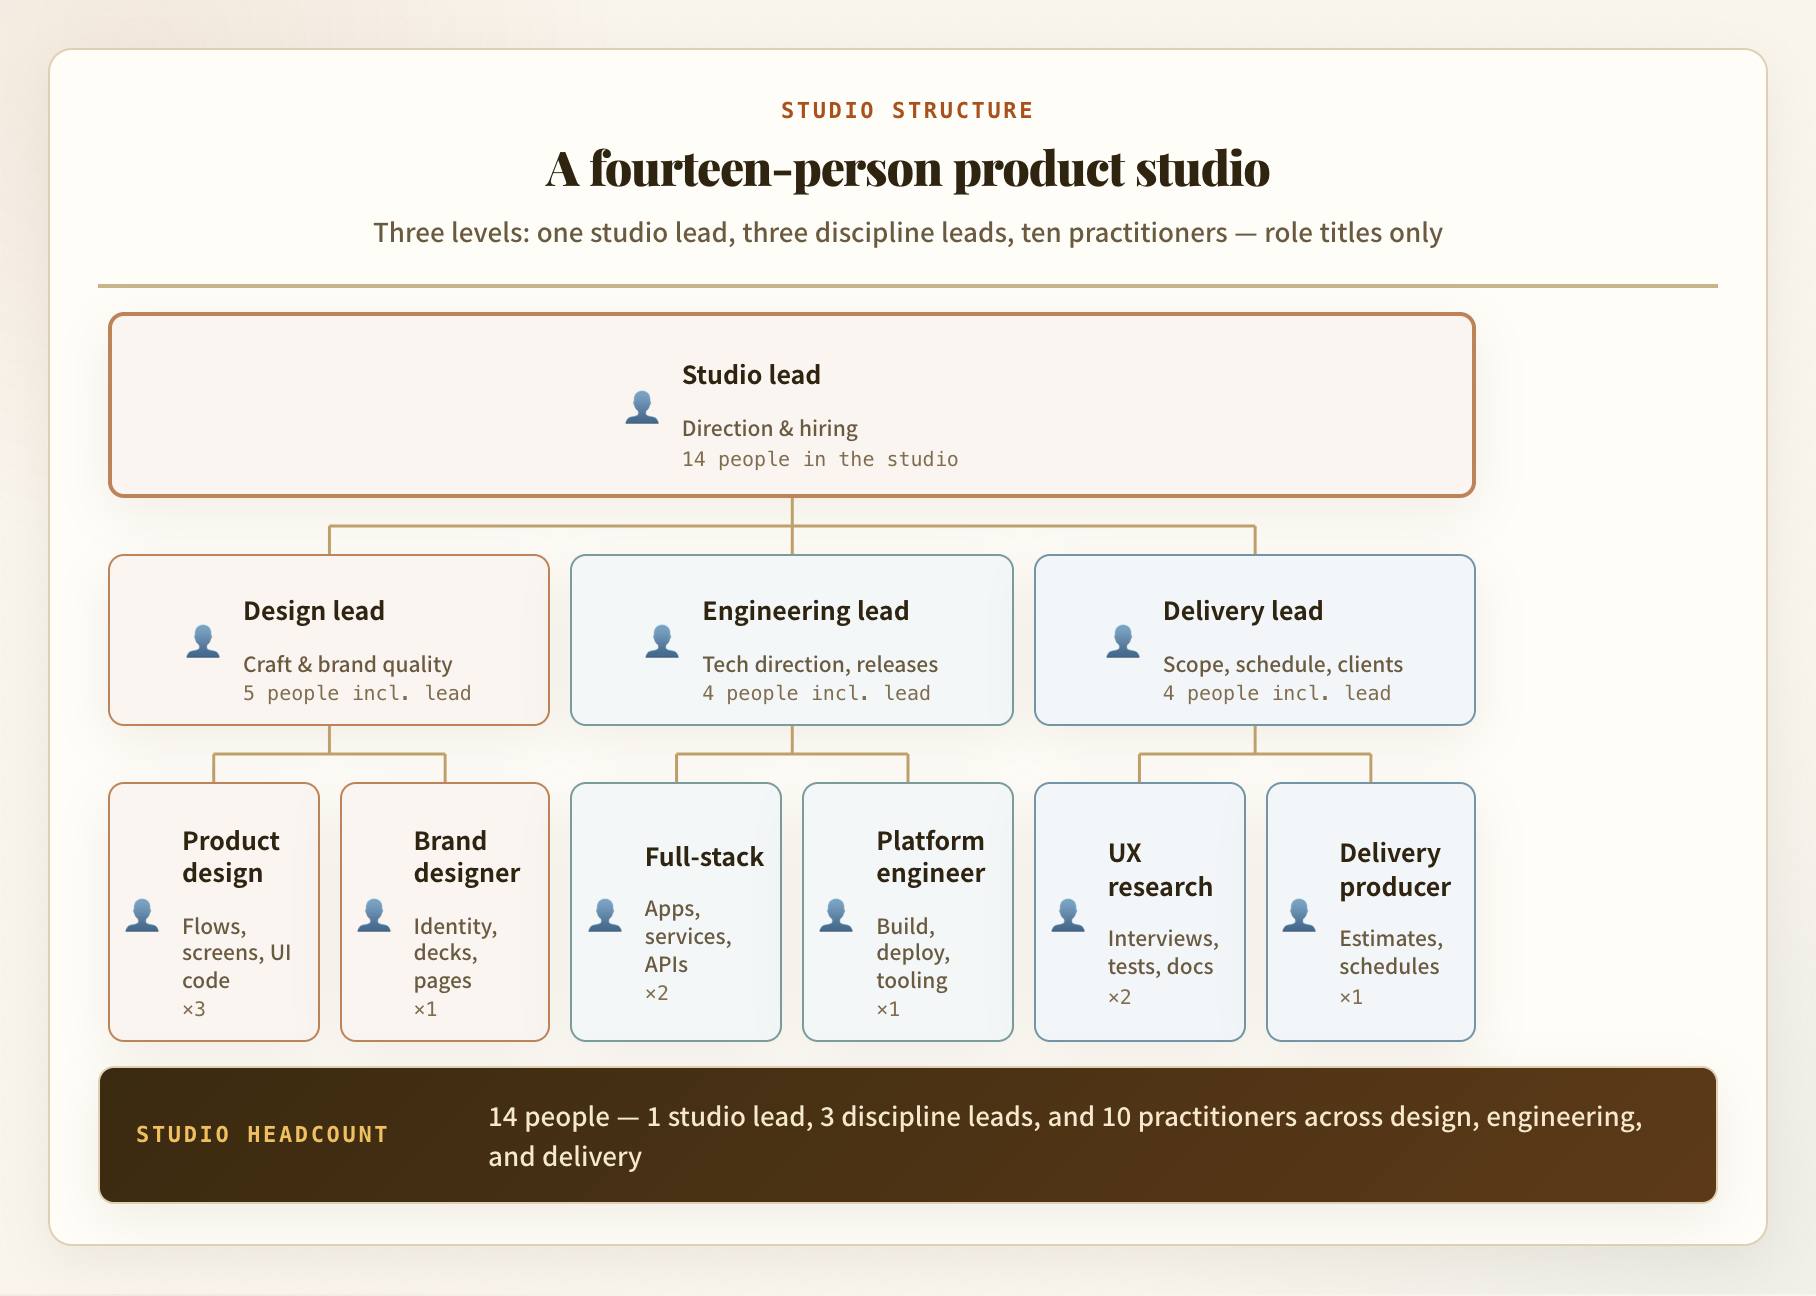
Org chart:A fourteen-person product studio
Rendered example Open HTML preview
Org chartwarm

A fourteen-person product studio

A three-level reporting tree where grouped practitioner cards and headcount badges add up to the stated total.

Read the source prompt
Draw a warm org chart for a 14-person product studio using role titles only, no names. A studio lead owns direction, client mix, and hiring. Three discipline leads report to them. Design lead, craft quality across product and brand work, 5 including the lead: two product designers (flows, screens, and prototypes), a brand designer (identity, decks, and site pages), a design technologist (living prototypes and UI code). Engineering lead, technical direction, review, and releases, 4 including the lead: a frontend engineer (client apps and shared UI code), a backend engineer (services, data models, and APIs), a platform engineer (build, deploy, and tooling). Delivery lead, scope, schedule, and client communication, 4 including the lead: a user researcher (interviews and usability tests), a technical writer (product docs and handover), a delivery producer (estimates, schedules, vendors). Show headcount per branch and the studio total.
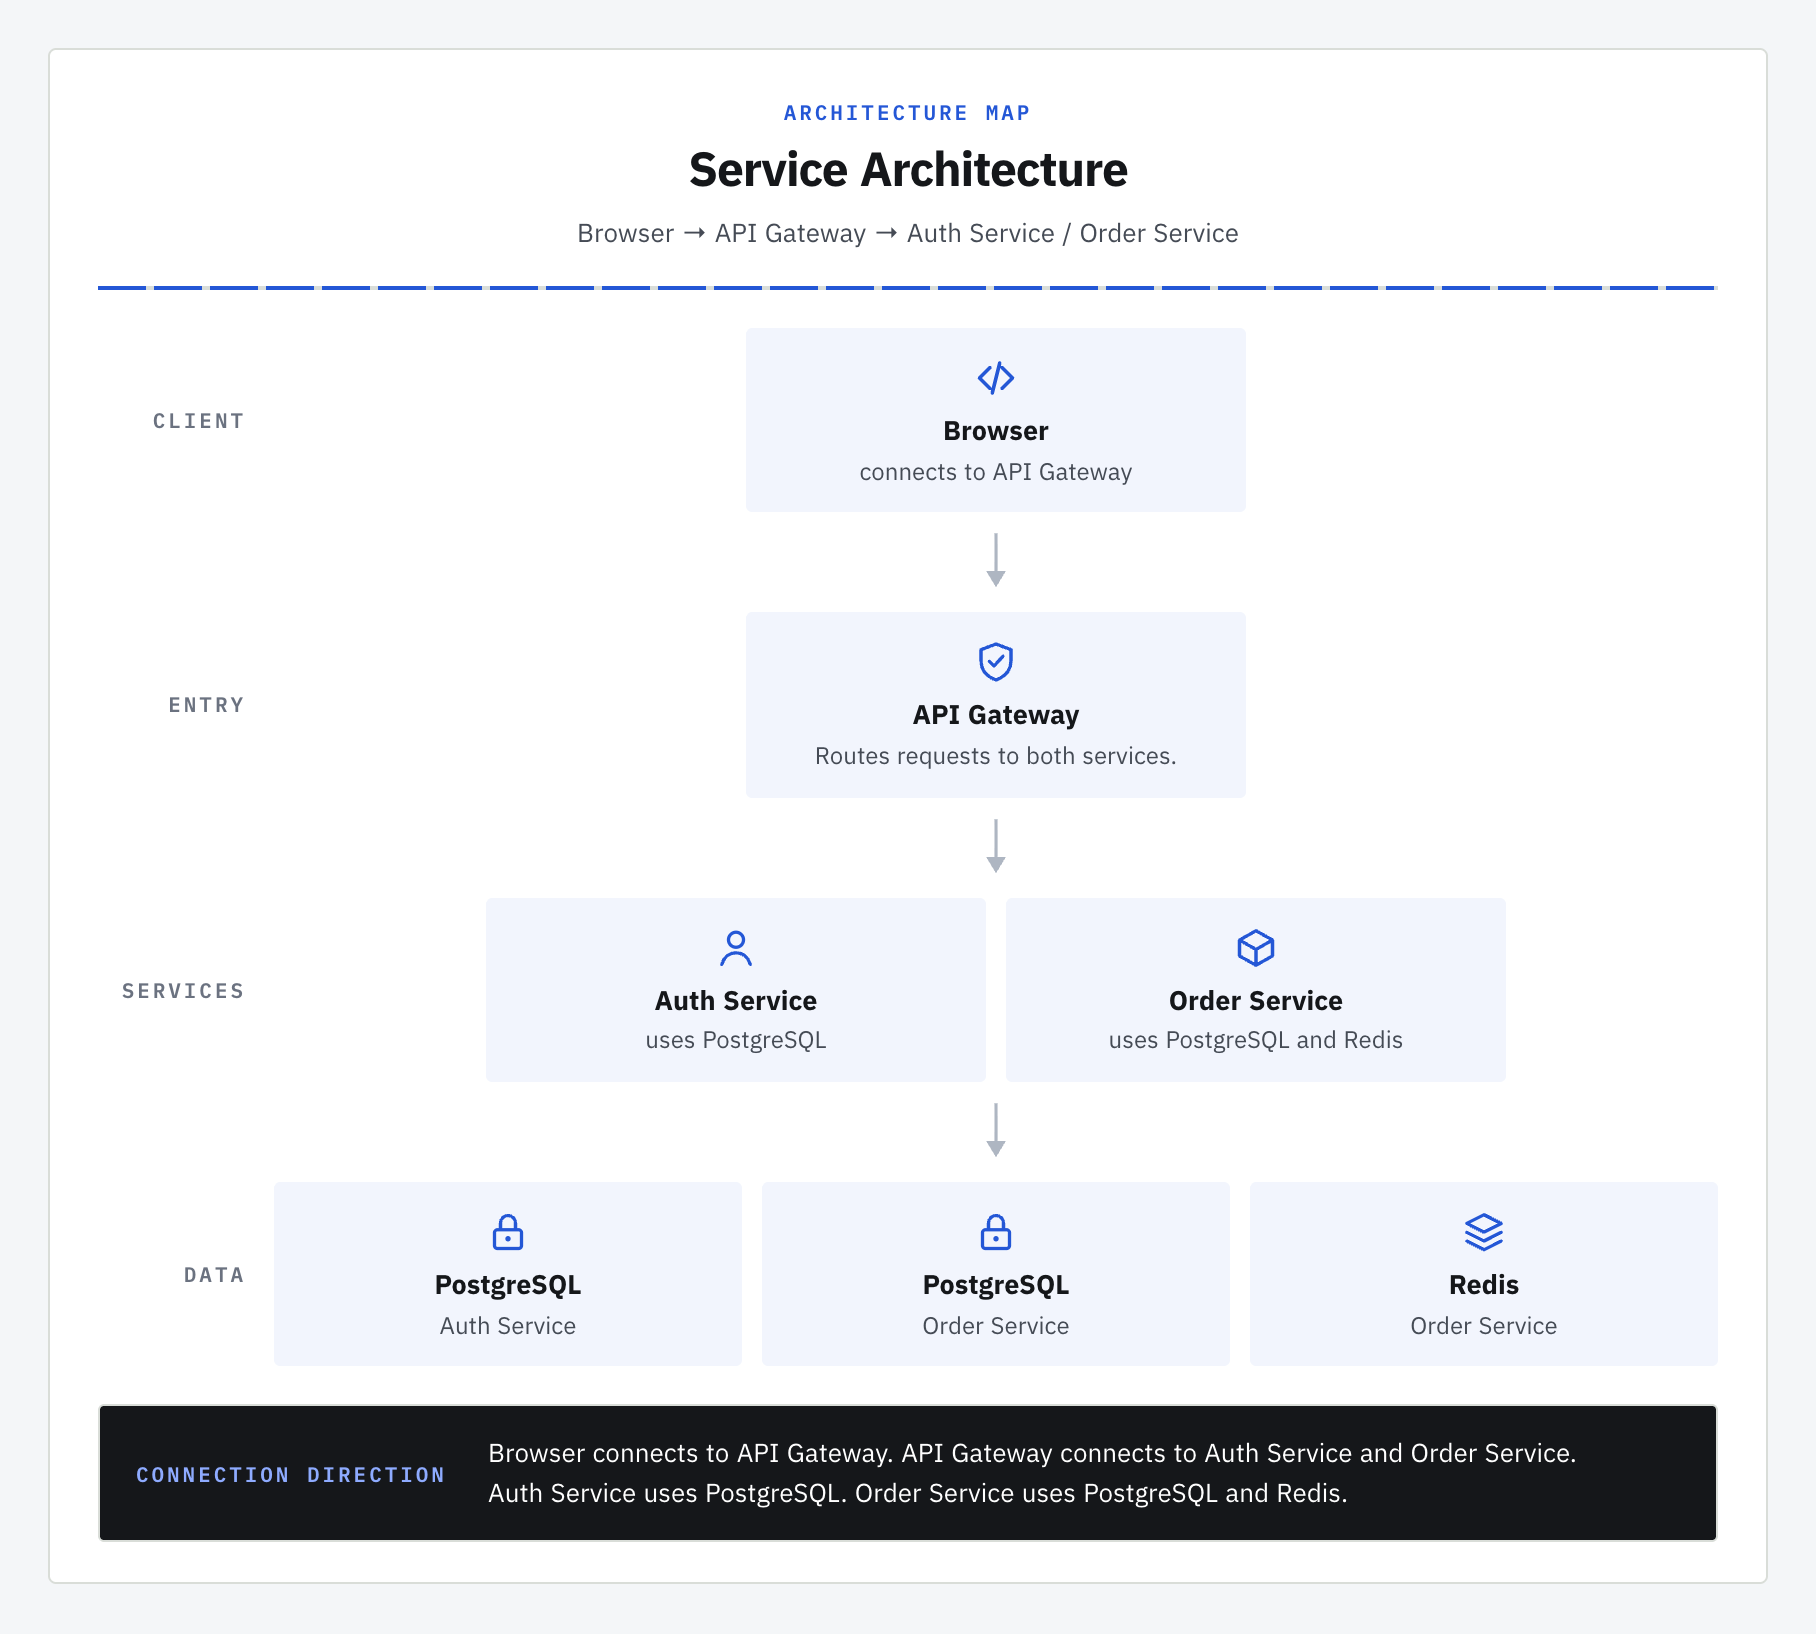
Architecture:Service Architecture
Rendered example Open HTML preview
Architectureclean

Service Architecture

Four labelled layers with per-service data ownership and no invented infrastructure.

Read the source prompt
Create a clean architecture diagram: Browser → API Gateway → Auth Service and Order Service. Auth Service uses its own PostgreSQL database. Order Service uses a separate PostgreSQL database and its own Redis. Show client, entry, service, and data layers, with ownership stated in node descriptions. Do not add cloud providers, protocols, ports, or metrics.

Find a diagram for the work in front of you

English and Chinese examples, with the source data and downloadable output. All example content is synthetic.

Make your first diagram

1. Install the skill

Run this in your terminal. Use Node.js 22.12+ and an installed Chrome-family browser. The agent installs the local runtime dependencies when needed.

npx skills add GODVvVZzz/text2html2png -g -y

2. Send a prompt to your agent

Copy a prompt from an example above, replace the description with your own, and send it to Codex, Claude Code, or another compatible agent.

HTML is the default deliverable. The copied prompt explicitly asks for PNG too. Keep the JSON to revise the content and render again.

Try the renderer locally

Edit Diagram JSON, preview, and export in your browser. This local playground does not convert free-form text; your agent handles that step.

git clone https://github.com/GODVvVZzz/text2html2png.git
cd text2html2png/skills/text2html2png
npm start

What keeps the result useful

Keep the supplied facts

The skill instructs the agent to preserve facts and relationships, and omit unsupported metrics. Review the meaning against your source before sharing.

Check the actual layout

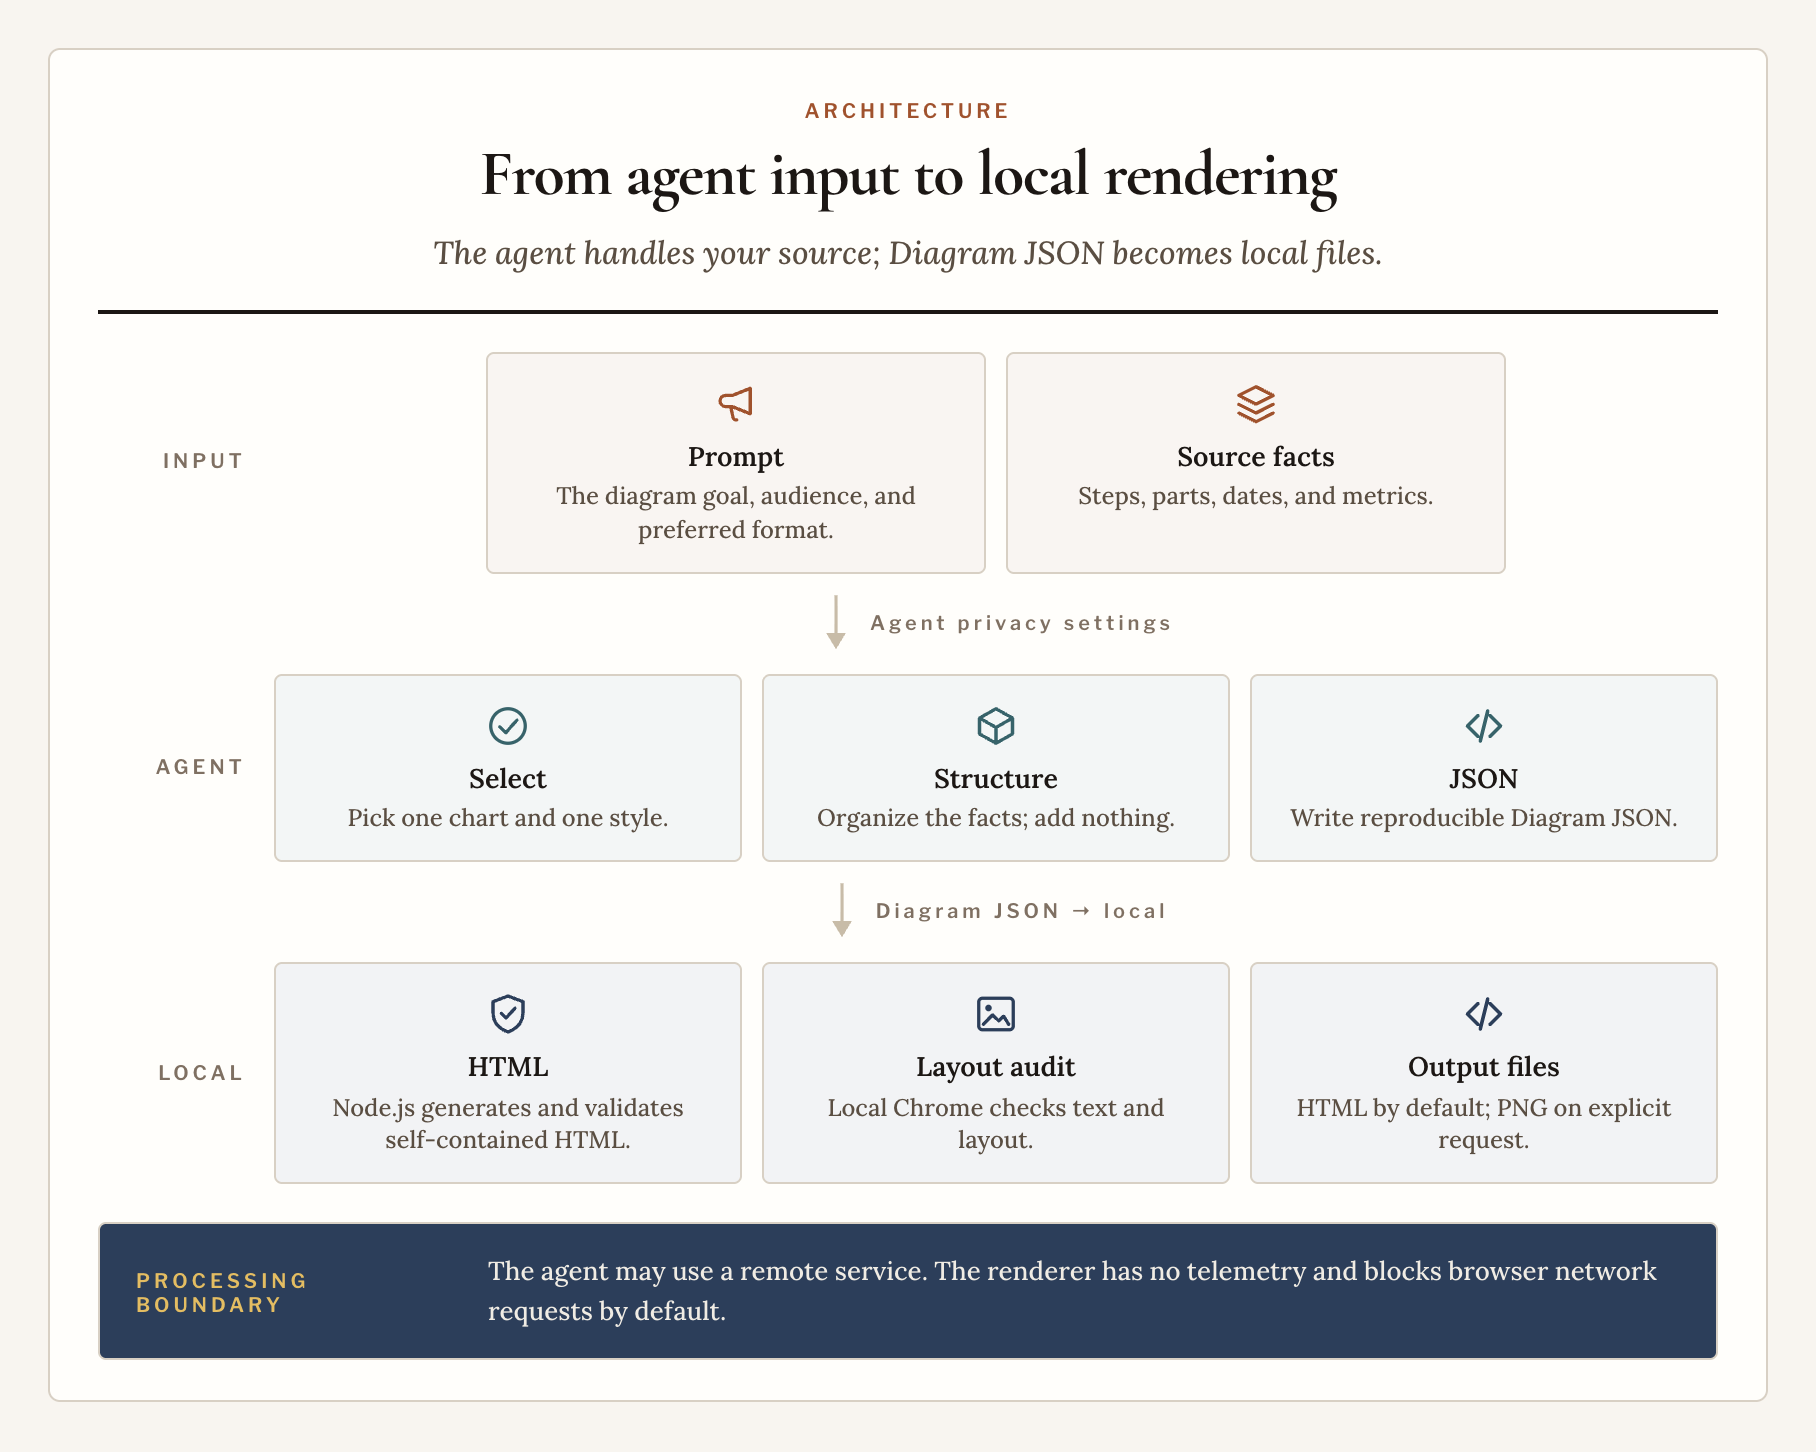
The browser audit checks clipping, overlap, contrast, and short Chinese labels. PNG export runs the audit before capturing the image.

Keep your source

HTML, PNG, and versioned Diagram JSON are files you can keep. Rendering runs locally; your agent’s handling of input depends on its service.

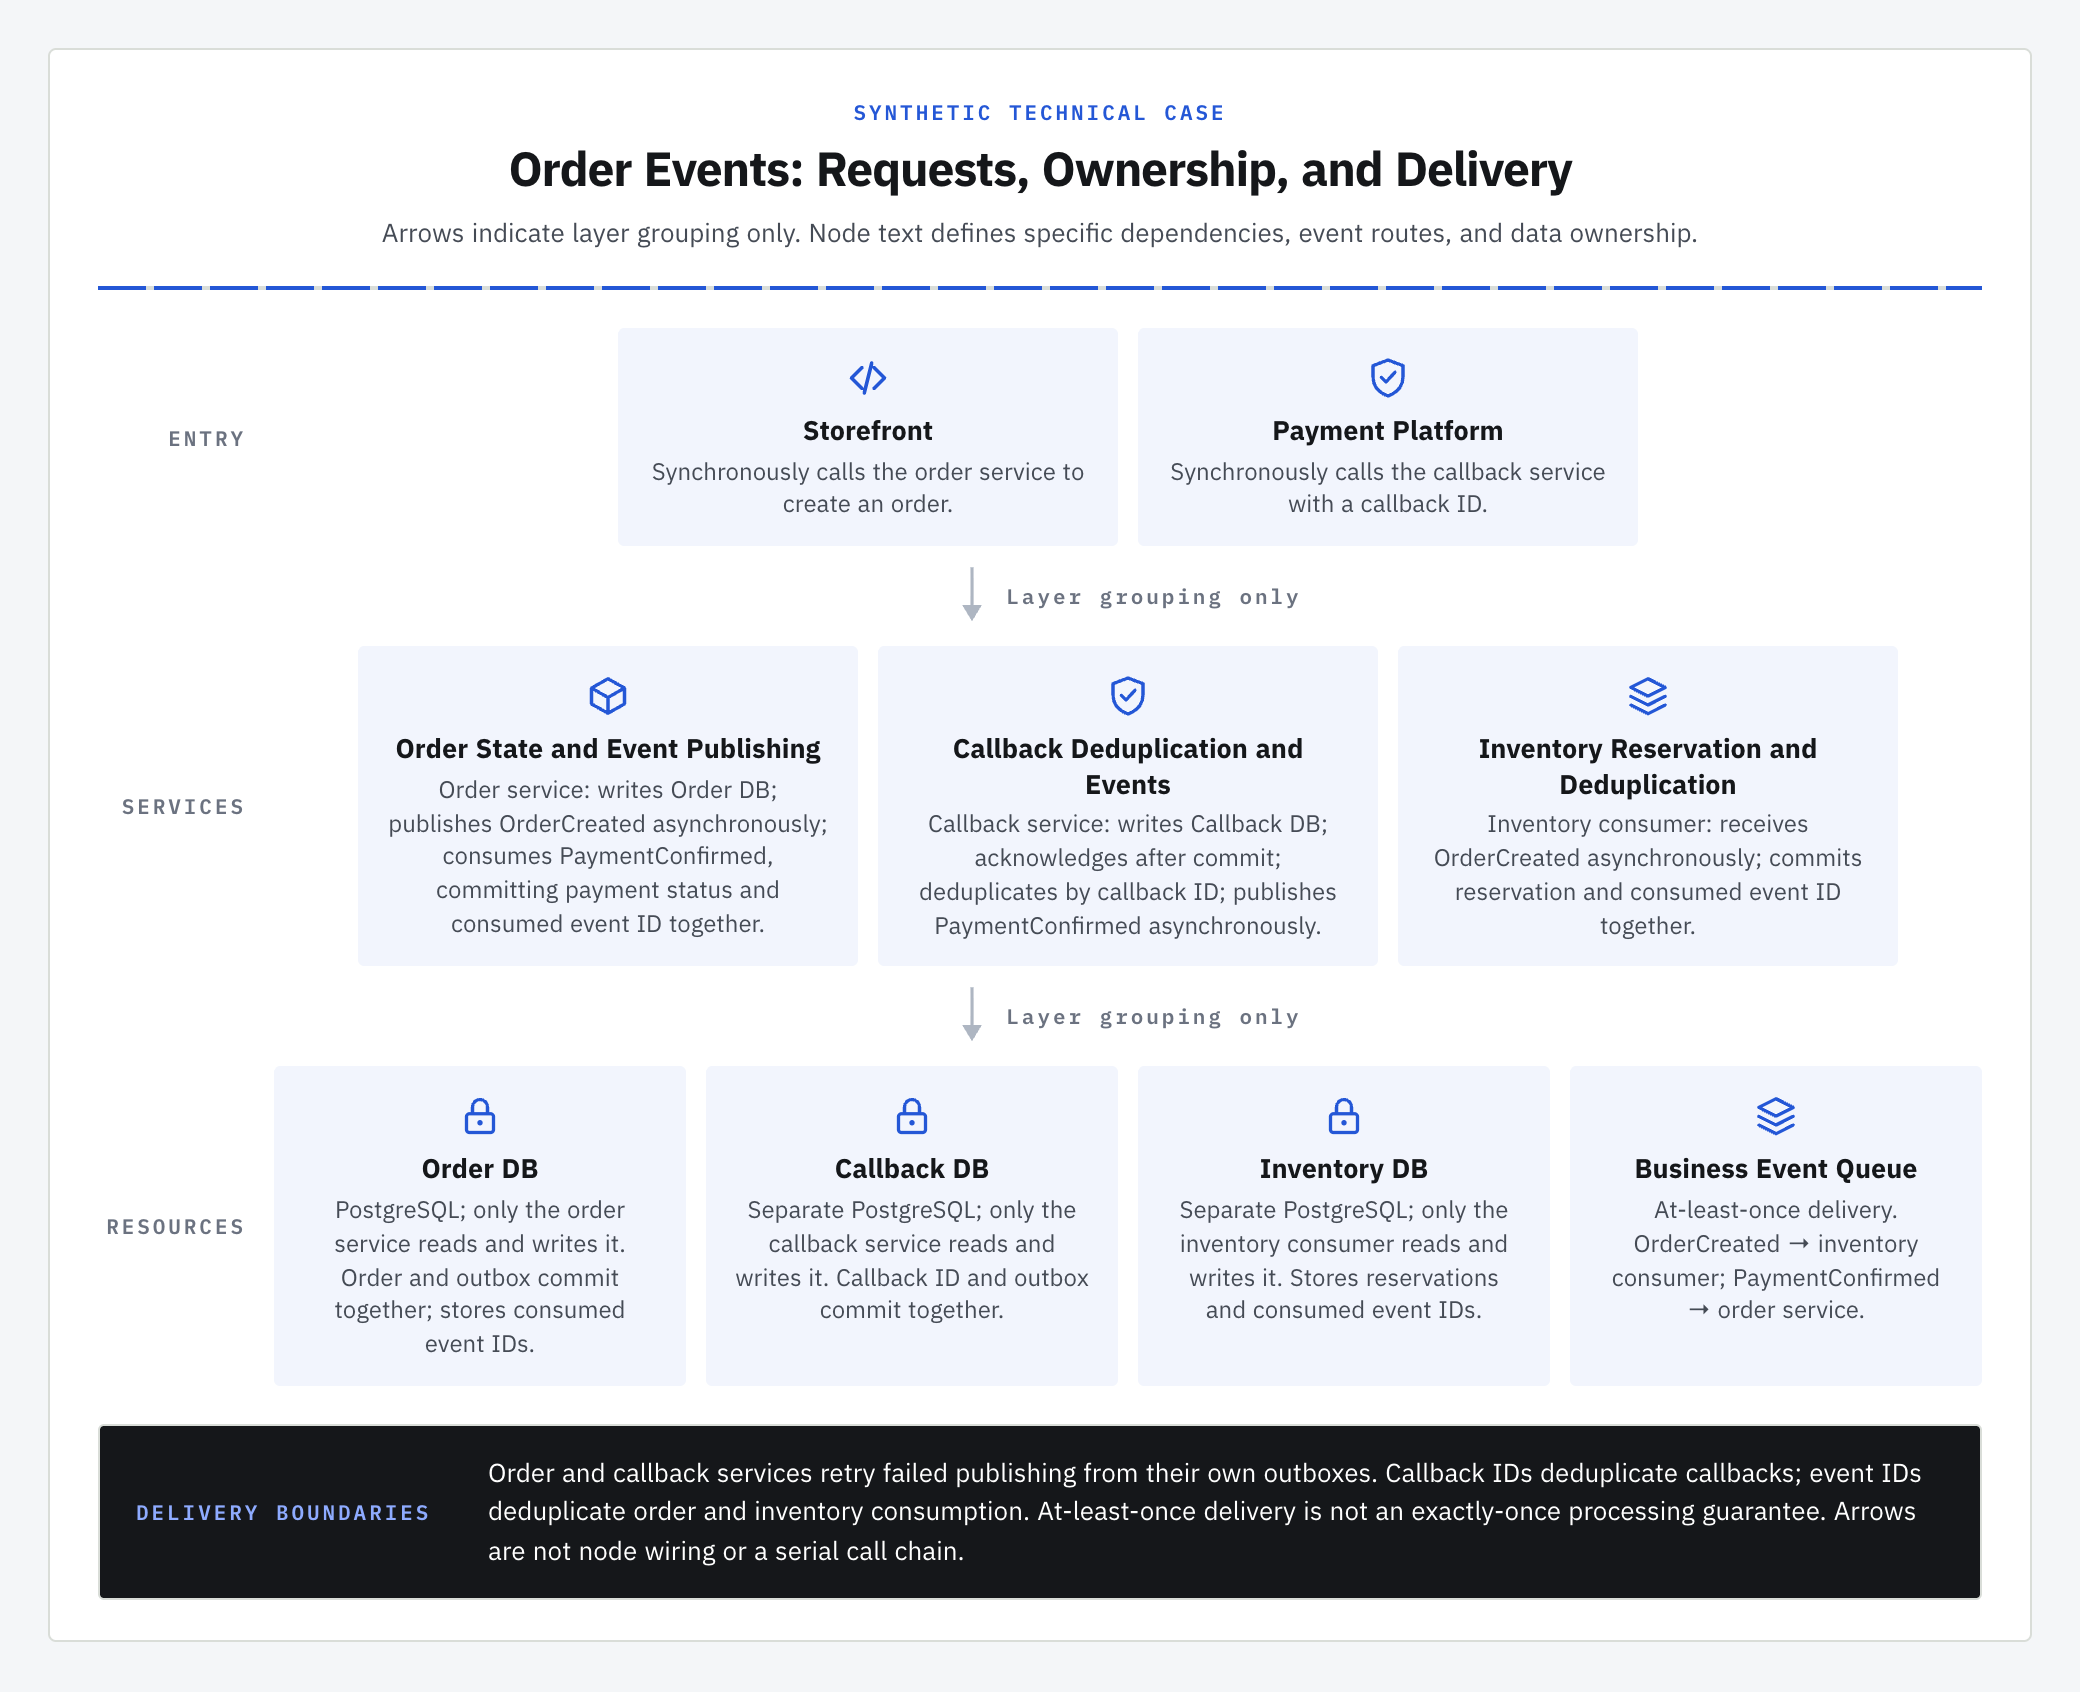
Architecture examples show layers; node descriptions state the specific dependencies. Use a graph editor for arbitrary node-to-node connections. Use a plotting library for scientific charts.